OSST label rate compliance.
Q&A with Gary Dorr of the APVMA on rate calculation and nozzle selection for Optical Spot Spray Technologies (OSST)

CEO
This question has arisen due to differences between rates shown on the chart provided to WeedSeeker owners by McIntosh’s and results displayed for WeedSeeker in the Fantastic Nozzles Spot-Spray App.
For example, on the Macintosh chart;
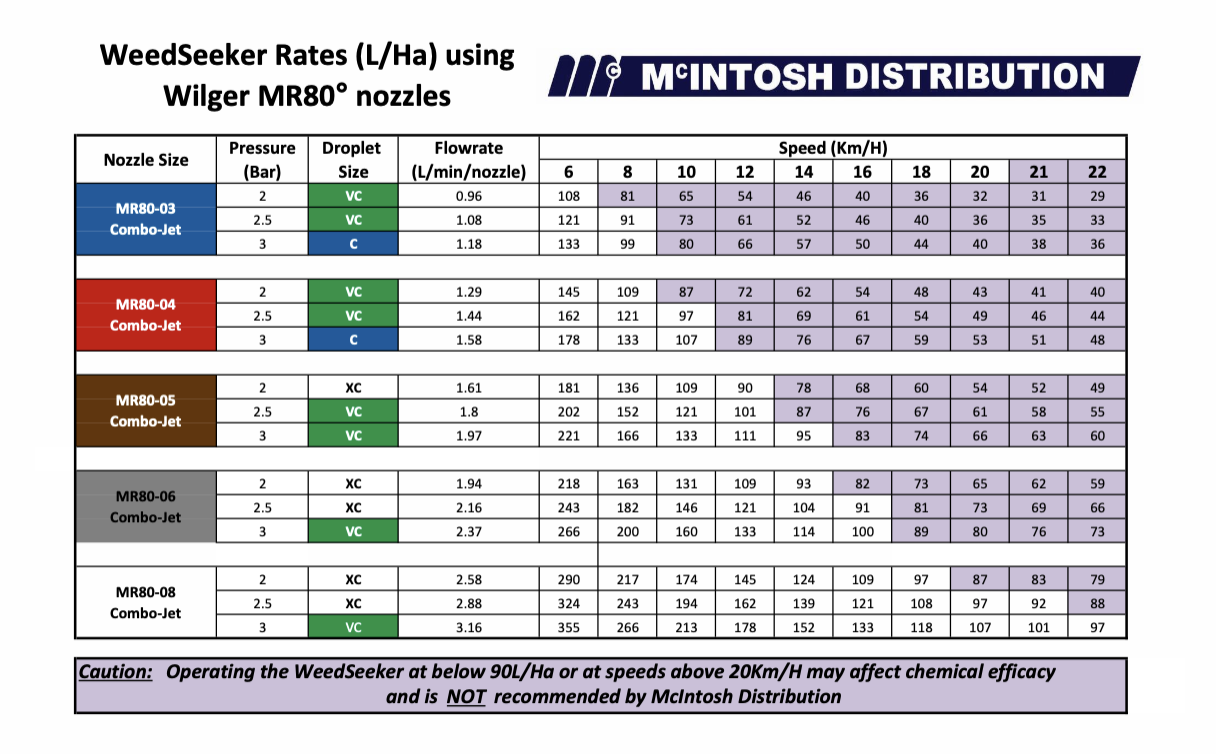
The chart was formulated after field testing using water sensitive papers in field conditions to determine an “effective spray width” of 89 cm upon which to base the chart. The tests were done on their behalf by Bill Gordon, who is known to us all and these figures are not in dispute.
I am suggesting that these results may be improved upon.
Now, on the the Spot-Spray App, based on the same parameters.
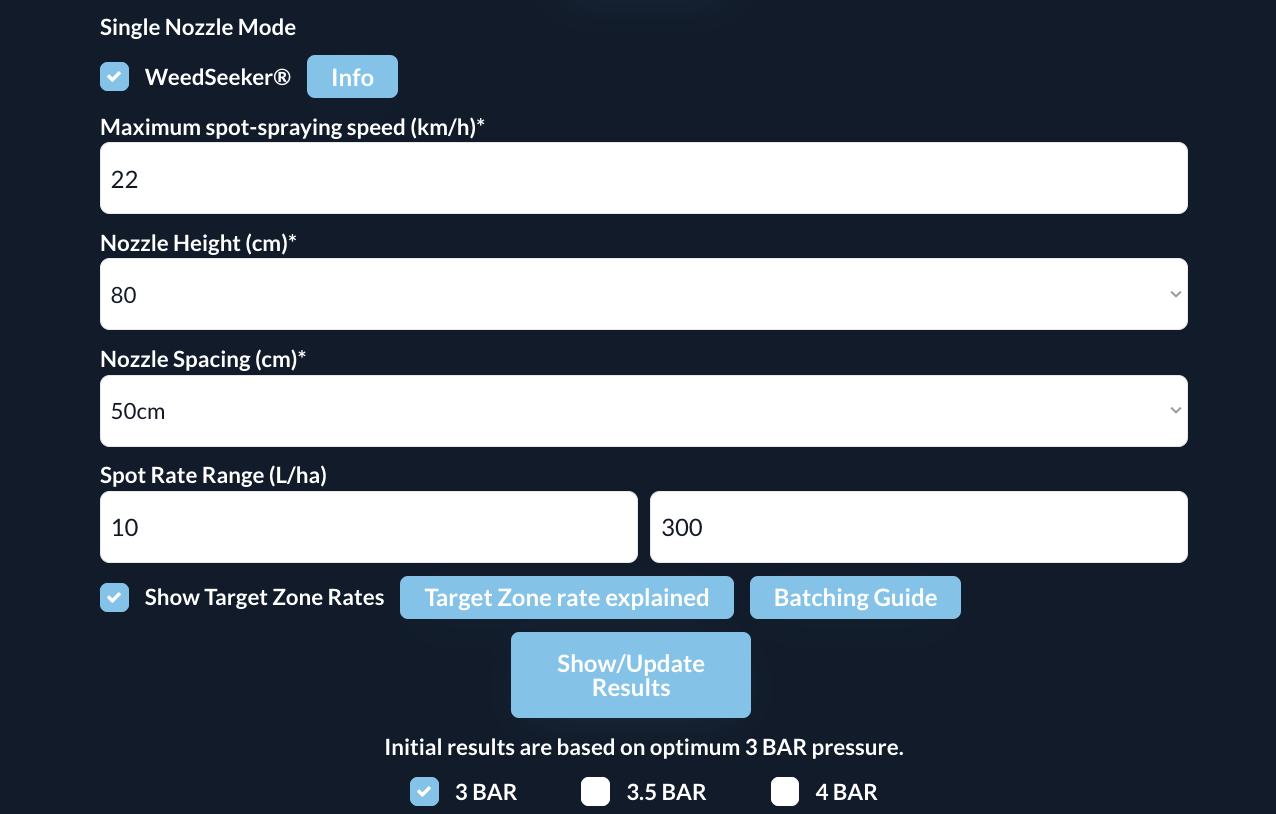
Things look quite different. We have 3 competing results;
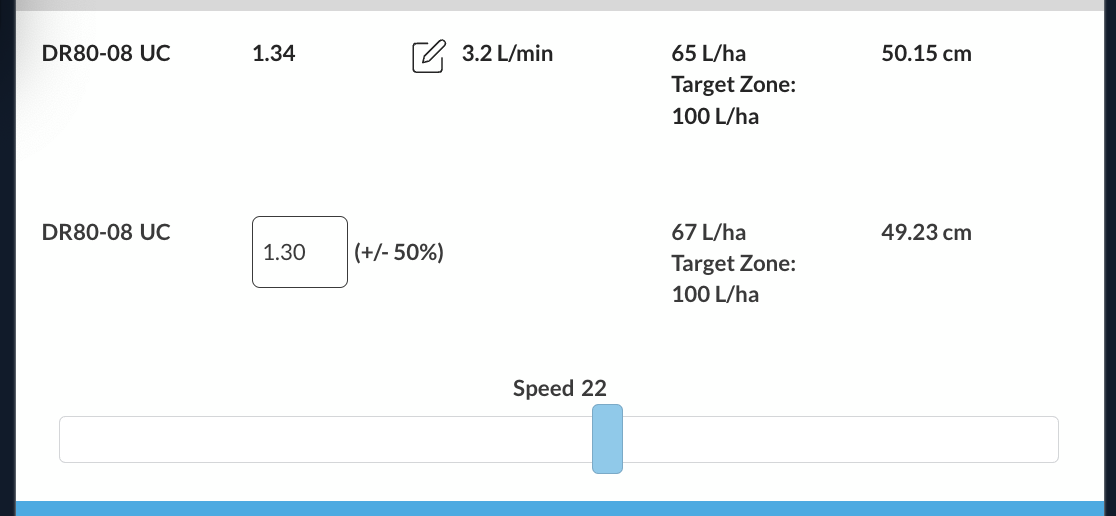
Briefly explaining the 3 different numbers above;
Why are all of these figures useful?
Firstly, the “effective spray-width” is a subjective value. A judgment call based on the WSP results. It could vary depending on nozzle types and spray qualities and not everybody’s circumstances are exactly the same.
A further limitation is that it gives us only one number to work with, which in the case of the Macintosh charts 89 cm. That does not take account of the fact that there is still a significant volume applied outside of the 89 cm which still needs to be accounted for overall value assessment.
What is different with our field test for spray width (1.3 m), is that we want to capture the total spray-width applied. I.e. where it stops from end to end. This is necessary to calculate a total actual hectares applied, not just the 90cm (Macintosh) or in our case the 50cm Target Zone.
Why else are these numbers useful?
It makes following the OSST label a piece of cake by mixing the appropriate number of liters of active up per the target Zone Rate figure, which in the example above is conveniently, 100 ;)
Here is another example of how to do your batching for same nozzles and pressure at a different speed of 16 km/h
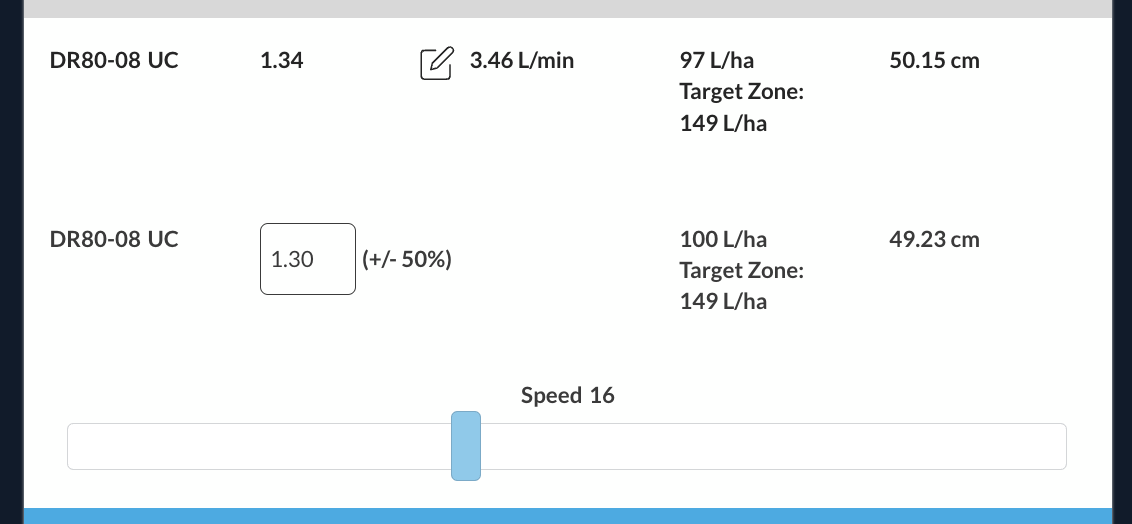
In this case you would batch up on the basis of X amount of active product per 149 liters of water to obtain the correct concentration of active on target. Got it?
In summary
In terms of lit/ha applied to the target, the Macintosh chart, and the Spot-Spray App Target Zone rates provide a similar result despite the fact that the McIntosh testing was conducted with an XR8006 (M) nozzle and our testing was conducted with Wilger MR80-08 (UC) nozzle.
The benefits of the App is that it provides a number for batching purposes where rates do not fall conveniently at 100/ha AND it provides an accurate figure of total l/ha applied based on the full measured spray width in your true value assessments.
Dave 21 April 2024
Get the Spot-Spray App at appcentral.online
For much more detail about Target Zone Rates, read our recent article here: OSST Label Rate Compliance
Read our other articles here.
Q&A with Gary Dorr of the APVMA on rate calculation and nozzle selection for Optical Spot Spray Technologies (OSST)
CEO
See & Spray Guidelines - Superseded on 14/03/2024 by OOST label rate compliance
CEO
Duty Cycle Apps and Spray Calculators
CEO
What gripes a nozzle guy!
CEO
110° nozzles on spot-sprayers - Really?
CEO
Determining Sprayed Width for L/ha Applications.
CEO
Spot-Spray basics.
CEO
Dave on Optical Spot Sprayer Nozzles
CEO
Bitcoin accounting for SME's
CEO
PWM v Air Induction for Drift Management & Coverage
CEO
Practical Guide to 2,4-D Spray Quality Compliance
CEO
Dave’s Concise Pulse Width Modulation Guide
CEO
Dave’s Concise Fungicide Spraying Guide
CEO
Dave’s Concise Stubble Spraying Guide
CEO
Dave’s Concise Spray Drift Management Guide
CEO
Explaining the Spray Quality Standard ASABE S572.1
CEO
An article about stubble jet.
CEO
An article about stopping weeds in wheel tracks.
CEO
Coarse sprays.
CEO
A three tier system (3TS) is one that essentially provides three different nozzle configurations using two “rows” of nozzles.
CEO